Compass UI Guide
Visual walkthrough of the Federal Frontier Compass interface — navigation, storage dashboard, AI chat, ontology browser, and graph visualization.
Compass UI Guide
This guide walks through the Compass user interface as seen by a platform operator. Compass is accessed at https://compass.vitro.lan and provides a unified view of all Federal Frontier Platform infrastructure.
Top Navigation Bar
The top navigation bar provides access to all major sections:
| Tab | Function |
|---|---|
| Explorer | Browse the FFO ontology tree — entities grouped by domain (Infrastructure, Security, Compliance, Workload, Identity) |
| Schema | View and explore the TypeDB schema — entity types, relation types, and attribute definitions |
| Integrations | Manage MCP server registrations, view tool counts, enable/disable servers |
| Storage | Ceph distributed storage dashboard — cluster health, pools, OSDs, monitors |
| Chat | AI-powered conversational interface for natural language infrastructure queries |
Ontology Browser (Left Sidebar)
The left sidebar displays the Digital Twin Browser — a hierarchical tree view of all entity types in the FFO ontology, organized by domain:

Infrastructure Domain
- Cluster — Kubernetes clusters (e.g., vitroai-fmc)
- Node — Worker and control-plane nodes
- Network — Cluster networking configuration
- StorageClass — Kubernetes storage classes
- Registry — Container image registries (e.g., Harbor)
- Image — Container images tracked in the ontology
Security Domain
- Finding — Security findings from scanners (Trivy, compliance checks)
- Vulnerability — CVEs linked to container images
- Threat — Threat intelligence entries
- Mitigation — Applied mitigations for findings
Compliance Domain
- Control — NIST 800-53, CMMC, and other framework controls
- Framework — Compliance frameworks (NIST, CMMC, FedRAMP)
- Assessment — Compliance assessment results
Workload Domain
- Deployment — Kubernetes deployments
- Service — Kubernetes services
- Pipeline — CI/CD pipelines
- Database — Managed databases
Identity Domain
- Principal — IAM users (Keycloak principals)
- IAM Role — Role definitions
- Group — User groups
- Service Account — Kubernetes service accounts
Each entity type shows a count and can be expanded to list individual entities with their attributes.
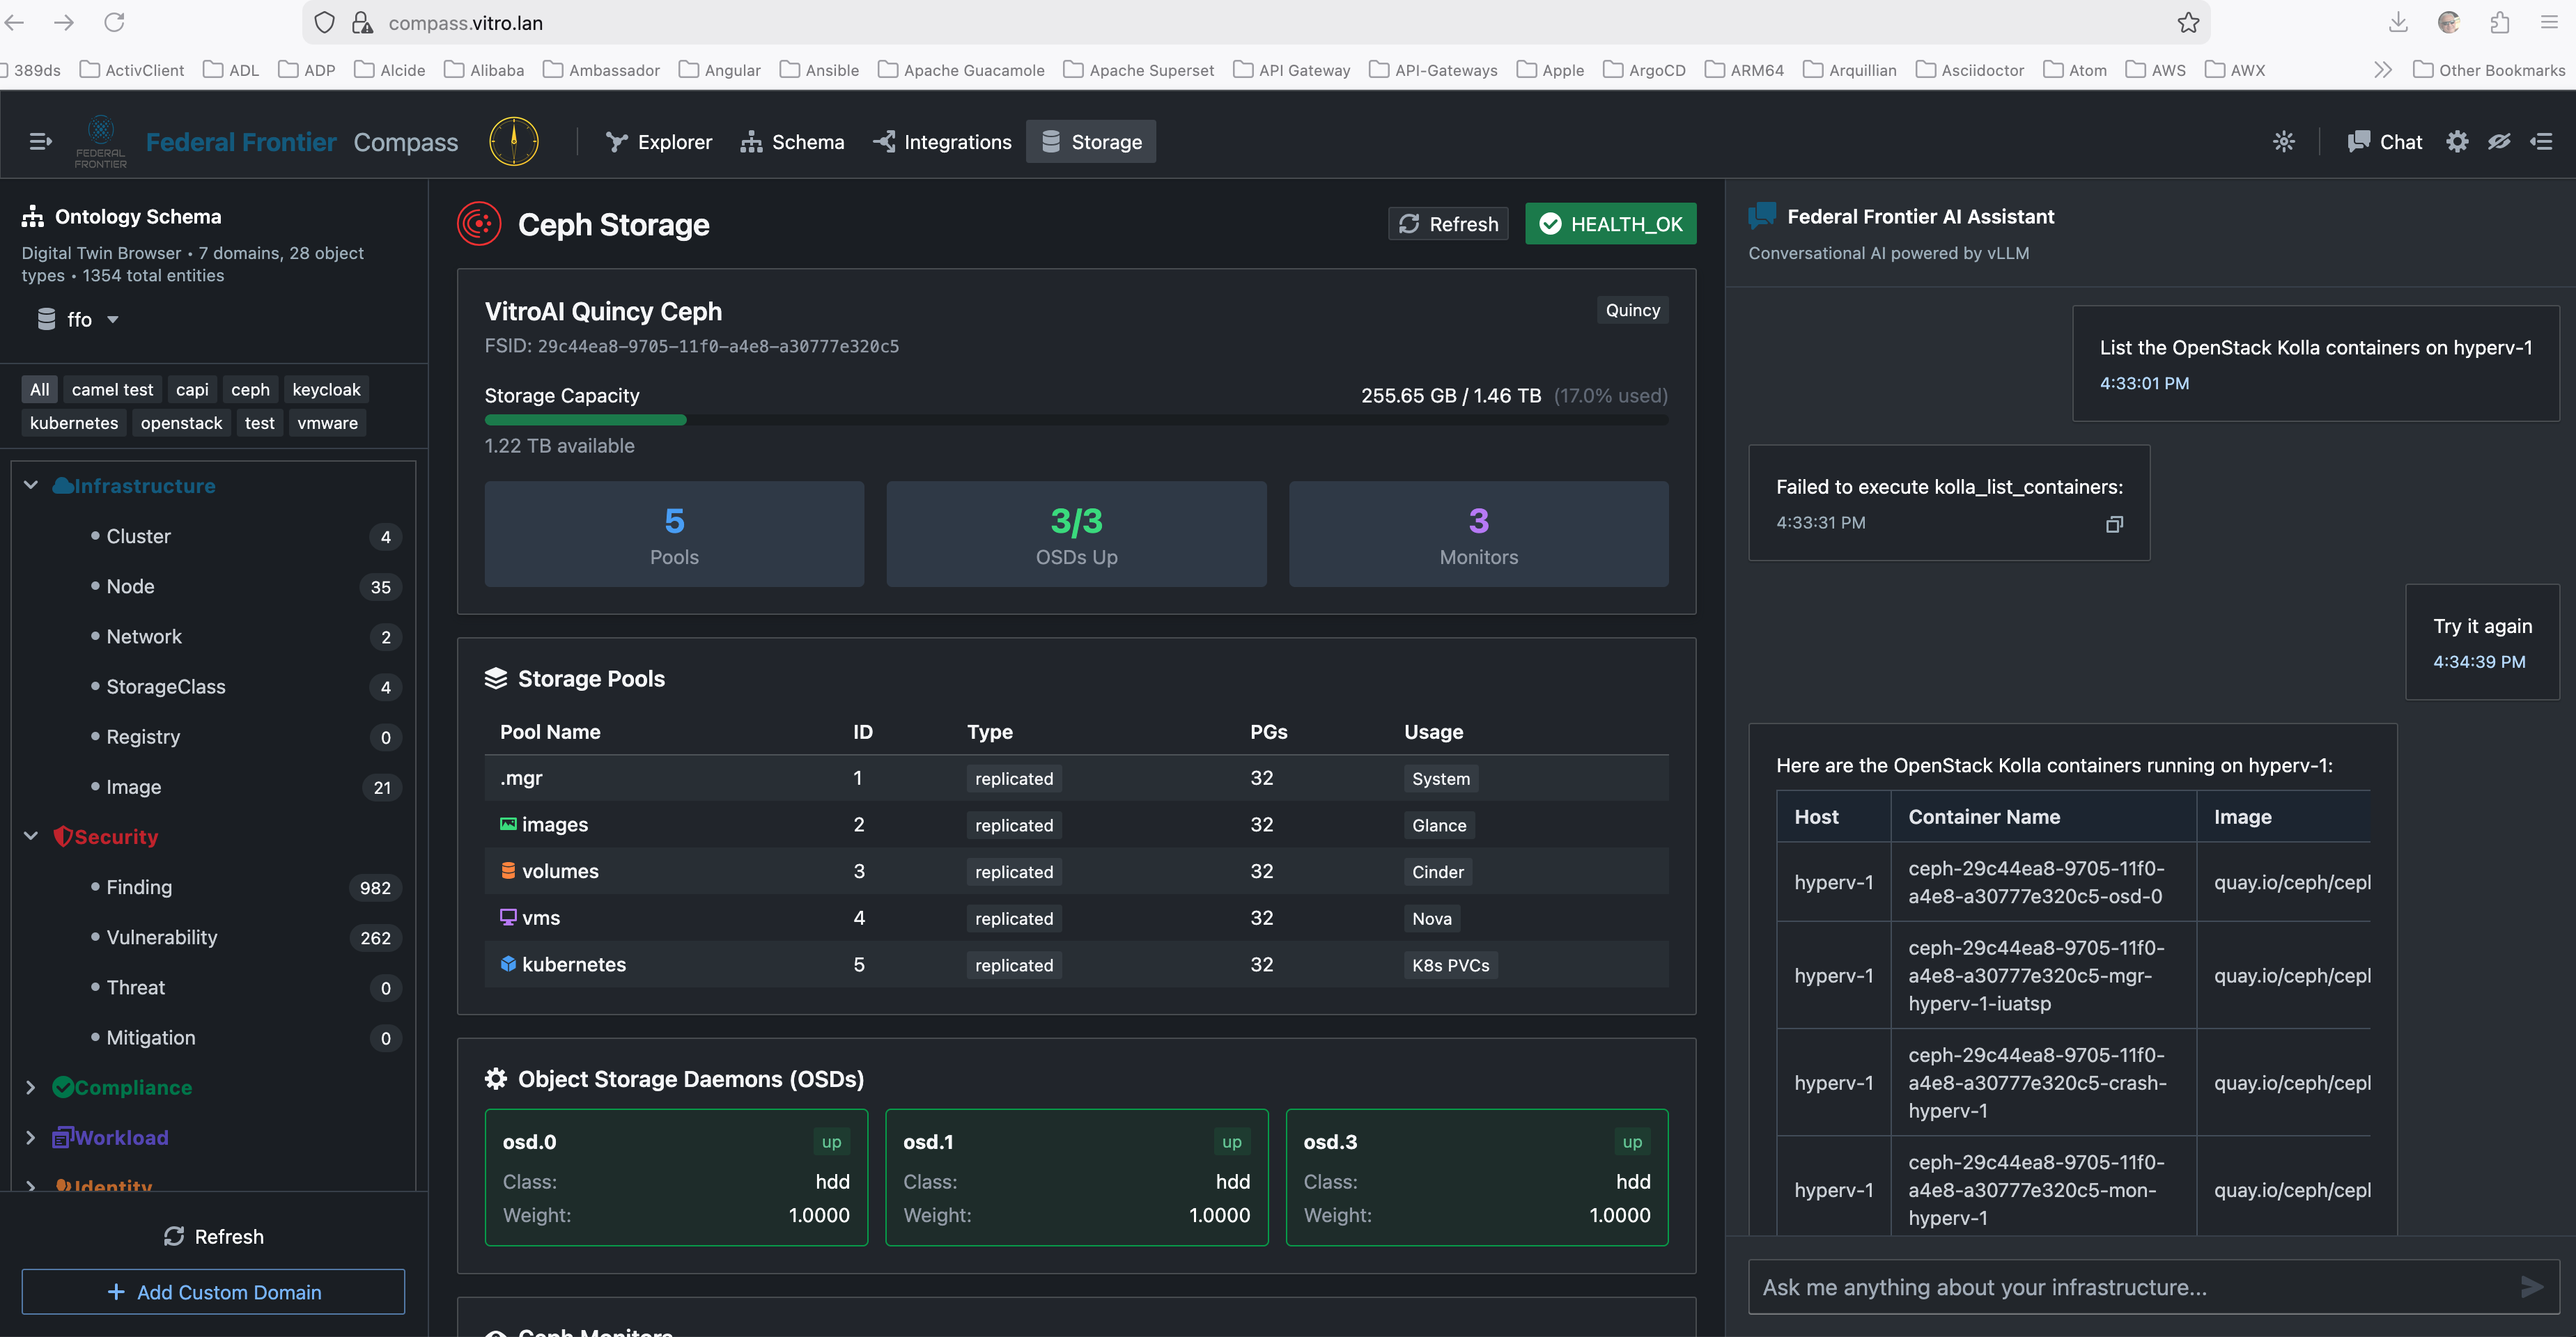
Ceph Storage Dashboard
The Storage tab provides a comprehensive view of the Ceph distributed storage cluster:

Cluster Overview
- Cluster name and FSID — e.g., “VitroAI Quincy Ceph” with unique FSID
- Storage capacity bar — Visual gauge showing used vs. total (e.g., 254.27 GB / 1.46 TB, 17.0% used)
- Available space — Remaining capacity at a glance
Summary Cards
Three summary cards provide instant status:
- Pools — Total number of storage pools (e.g., 5)
- OSDs Up — Object Storage Daemons status (e.g., 3/3 up)
- Monitors — Ceph monitor count (e.g., 3)
Storage Pools Table
| Column | Description |
|---|---|
| Pool Name | Name of the Ceph pool (e.g., .mgr, images, volumes, vms, kubernetes) |
| ID | Numeric pool identifier |
| Type | Replication type (replicated) |
| PGs | Placement Groups count |
| Usage | What the pool is used for (System, Glance, Cinder, Nova, K8s PVCs) |
Example pools in a typical deployment:
| Pool | Usage |
|---|---|
| .mgr | System (Ceph manager) |
| images | Glance (OpenStack image storage) |
| volumes | Cinder (OpenStack block storage) |
| vms | Nova (OpenStack VM ephemeral storage) |
| kubernetes | K8s PVCs (Persistent Volume Claims) |
Object Storage Daemons (OSDs)
Each OSD is displayed as a card showing:
- OSD ID (e.g., osd.0, osd.1, osd.3)
- Status — “up” with green indicator
- Device Class — Storage device type (hdd, ssd, nvme)
- Weight — CRUSH weight for data distribution (typically 1.0000)
Ceph Monitors
Monitor nodes are listed with their addresses, state (leader, peon), and health status.
Health Banner
A prominent health indicator appears at the top:
- HEALTH_OK (green) — All components healthy
- HEALTH_WARN (yellow) — Warnings present (e.g., undersized PGs, clock skew)
- HEALTH_ERR (red) — Critical issues requiring attention
AI Chat Interface
The Chat panel (right side of the screen) provides the Federal Frontier AI Assistant — a conversational interface powered by LLM-based tool calling.

How It Works
- Type a natural language question in the input box
- The system either matches a query template (instant response) or routes to the LLM with 150+ MCP tools
- Results are formatted as markdown tables for readability
- A copy button on each response lets you copy the content to clipboard
Example Queries
Infrastructure queries:
- “List the containers on hyperv-1” → Calls
kolla_list_containers→ Returns table with container name, image, status - “How many clusters do we have?” → Matches template → Queries FFO TypeDB
- “Show me the nodes” → Matches template → Returns node names and types
Storage queries:
- “Ceph health” → Matches template → Returns cluster health, capacity, pool status
- “List OSDs” → Matches template → Returns OSD names, status, device class
- “How is the storage?” → Matches template → Returns capacity breakdown
Identity queries:
- “List users in FAS realm” → Matches template → Calls Keycloak MCP → Returns user table
- “Who are the users?” → Matches template → Returns principal list from FFO
Operations queries:
- “List MCP servers” → Matches template → Returns table of all 12 servers with tool counts
- “Kolla services” → Matches template → Calls Kolla MCP → Returns service-to-container mapping
- “Show ArgoCD apps” → Routes to LLM → Calls ArgoCD MCP tools

Response Formatting
All tabular results render as proper HTML tables with:
- Sortable column headers
- Row highlighting on hover
- Responsive horizontal scrolling for wide tables
- Dark theme styling consistent with the Compass UI
Chat Architecture
User query
    │
    ▼
Template matcher (keyword patterns)
    │
    ├── Match found → Execute directly (instant)
    │   ├── TypeQL query → FFO TypeDB
    │   ├── API call → /integrations/servers
    │   └── MCP tool → JSON-RPC to MCP server
    │
    └── No match → LLM path
        ├── Load 150+ tools from DB + MCP_SERVERS dict
        ├── Send to Ollama/vLLM with tools array
        ├── LLM returns tool_calls
        ├── Execute tool calls against MCP servers
        └── Format results as markdown tables
Instance Graph (Explorer Tab)
The Explorer tab renders an interactive graph visualization using ReactFlow:

- Nodes represent FFO entities (clusters, nodes, deployments, findings, etc.)
- Edges represent TypeDB relations between entities
- Color coding differentiates entity types at a glance
- Click any node to inspect its attributes in a detail panel
- Zoom/pan to navigate large graphs
- Limited to 100 nodes to maintain performance
Schema Browser
The Schema tab provides a read-only view of the FFO TypeDB schema:

- Entity types with their attributes and value types
- Relation types with their role players
- Inheritance hierarchies
- 7 domains, 28 object types as reported by the schema browser
Integrations Panel
The Integrations tab shows all registered MCP servers:

- Server name, description, URL, tool count, enabled/disabled status
- Currently 12 servers with 150+ tools total
- Servers can be enabled/disabled without redeployment
- Tool discovery happens at startup from the Postgres
mcp_serverstable