Migration Monitor Dashboard
Real-time split-pane dashboard for monitoring VMware-to-OpenStack migrations — interactive controls, per-VM progress, and flavor matching.
Migration Monitor Dashboard
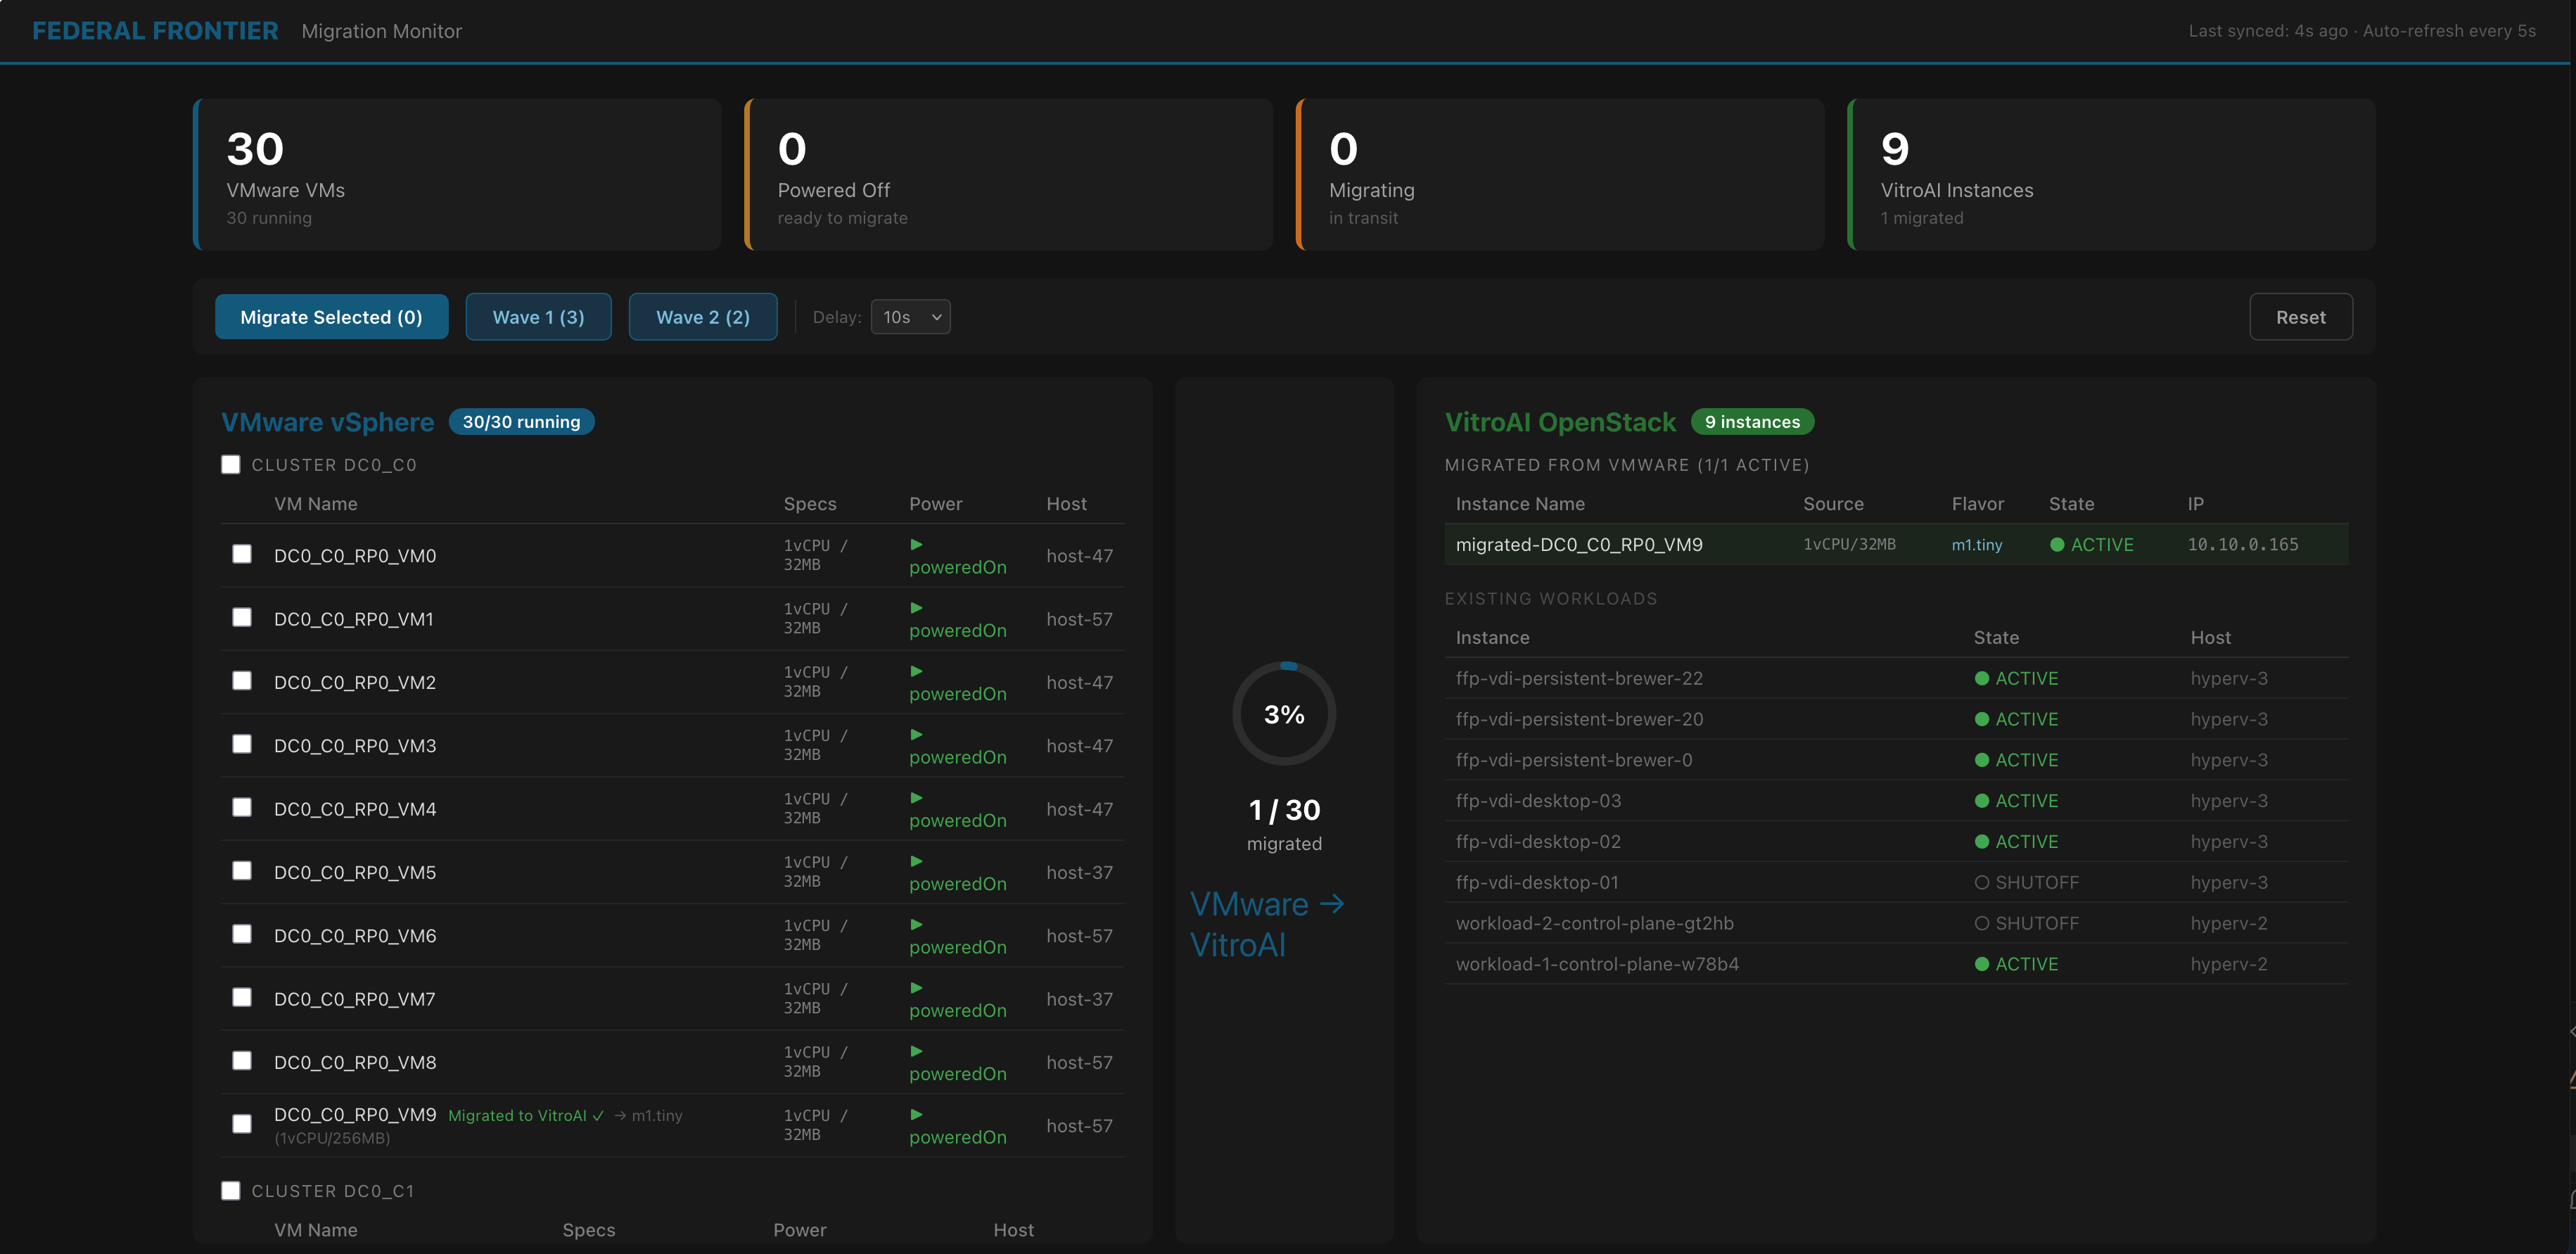
The Migration Monitor is a real-time web dashboard that shows the state of both your VMware and OpenStack environments side-by-side during migration. It provides interactive controls for triggering migration waves, monitoring per-VM progress through each phase, and verifying successful completion.
Dashboard Layout
Header Bar
- Federal Frontier Platform branding with “Migration Monitor” label
- Last sync timestamp and auto-refresh indicator (polls every 5 seconds)
Summary Cards
Four cards across the top showing key metrics:
- VMware VMs — total count and running count
- Powered Off — VMs that have been powered off during migration
- Migrating — VMs currently in transit (pre-copy, cutover, or launching)
- OpenStack Instances — total count including migrated workloads
Control Bar
Horizontal toolbar between the summary cards and the main view:
- Migrate Selected (N) — triggers migration of checked VMs. Disabled when no VMs are selected or a migration is in progress.
- Wave 1 / Wave 2 — quick buttons for predefined migration waves
- Delay — configurable transfer simulation time (5s to 20s) for demo pacing
- Reset — returns both environments to their initial state (with confirmation dialog)
Split-Pane View
| Left Pane: VMware vSphere | Center | Right Pane: OpenStack |
|---|---|---|
| VM inventory grouped by cluster | Progress circle (N/30 migrated, percentage) | Migrated instances with source specs |
| Checkbox selection per VM | Directional indicator (VMware → OpenStack) | Existing workloads (visually separated) |
| Power state, specs, host | Instance state, flavor, IP address |
Interactive Migration
Selecting VMs
Each VM row in the left pane has a checkbox. Only powered-on VMs are selectable — VMs already powered off (from a previous migration) are shown in amber and cannot be re-selected.
Cluster headers have a “Select All” checkbox that selects all powered-on VMs in that cluster.
Triggering Migration
Click Migrate Selected or a Wave button to start migration. The HTTP response returns immediately with a job ID — the actual migration runs asynchronously. The dashboard polls the migration API every 5 seconds for status updates.
Per-VM Progress
During migration, each VM in the left pane shows its current step:
| Step | Indicator | VM State |
|---|---|---|
| Pre-copying disks… | Blue text with pulsing dot | VM still running on VMware (green) |
| Final cutover… | Amber text | Brief power-off window |
| Launching on OpenStack… | Amber text | Instance being created |
| Migrated ✓ | Green text | Instance ACTIVE on OpenStack |
The critical visual: during the pre-copy phase (the longest phase), VMs stay green and running. The prospect sees their workloads staying up during migration.
Flavor Matching Display
Each migrating VM shows the source specs and matched OpenStack flavor:
DC0_C0_RP0_VM0 1vCPU/32MB Launching... → m1.tiny (1vCPU/256MB)
The right pane also shows the source specs and matched flavor for each successfully migrated instance.
Right Pane: Target Environment
The right pane has two sections:
Migrated from VMware — instances created by the migration process. Shows instance name, source VM specs, matched flavor, state (BUILD → ACTIVE), and assigned IP address. During pre-copy, placeholder rows appear in italic showing “Pre-copying from VMware…” before the actual OpenStack instance exists.
Existing Workloads — pre-existing OpenStack instances not related to migration. Shown in dimmed text to distinguish from migration activity.
Reset / Cleanup
Clicking Reset (with confirmation) reverses all migration activity:
- Deletes all OpenStack instances with the
migrated-prefix - Powers all VMware VMs back on
- Returns the dashboard to its initial state
Only migrated-* instances are affected — existing workloads are never touched.
Planned Enhancements
- Network Mapping Tab — visualization of VMware port group to OpenStack network mappings, with unmapped networks highlighted for human review
- Infrastructure Topology Tab — clusters, hosts, datastores, and hypervisors from both environments for full context
- FFO Migration Timeline — queryable migration history from the knowledge graph, showing every state transition with timestamps
- Compliance Posture Indicator — real-time ATO status throughout migration